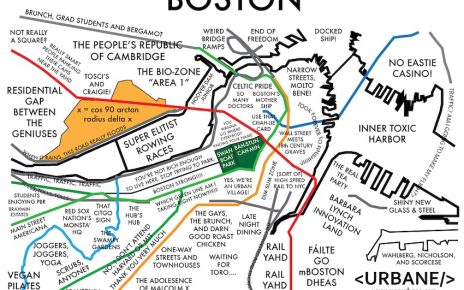
A recent Northeastern graduate, DJ Hartman, recently put together some city-wide maps, highlighting various economic metrics by neighborhood. Let’s take a look at the North End / Waterfront and downtown Boston area.
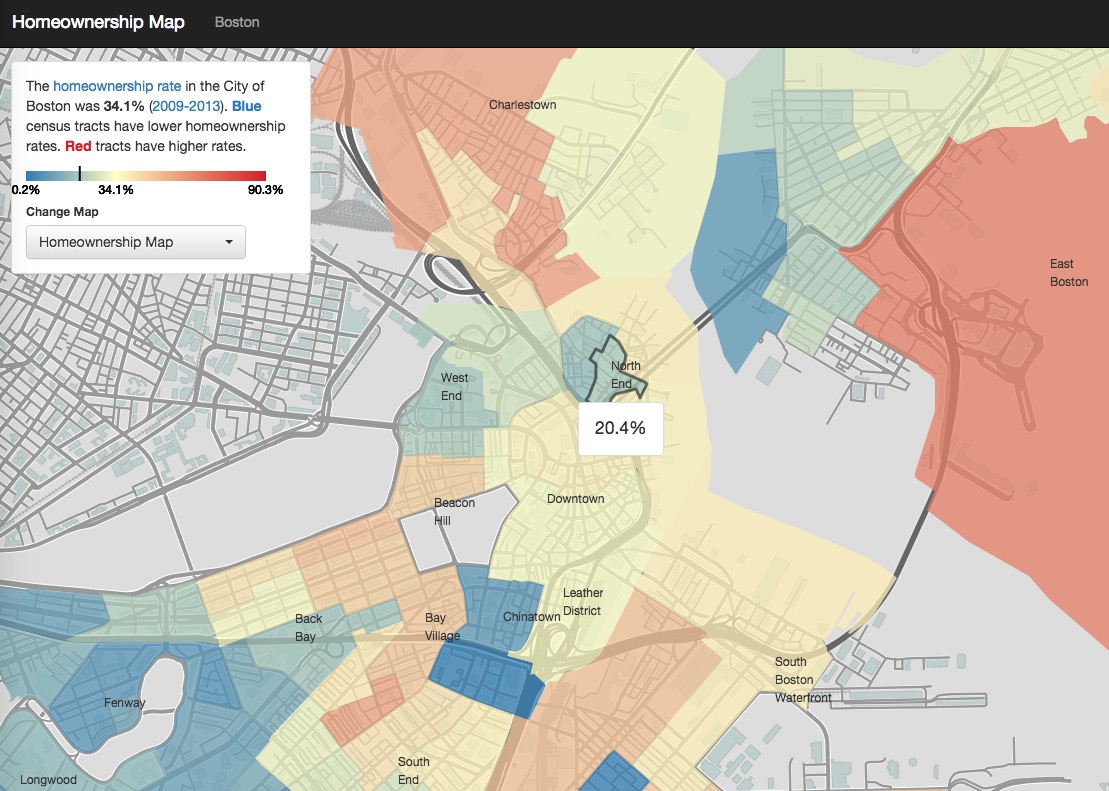
The homeownership rate in the City of Boston is 34.1% (2009-2013). The North End is more transient and rental driven with a homeownership rate of only 16% – 21%. The exterior waterfront and downtown area show home ownership rates near 40% with their condo-heavy development.
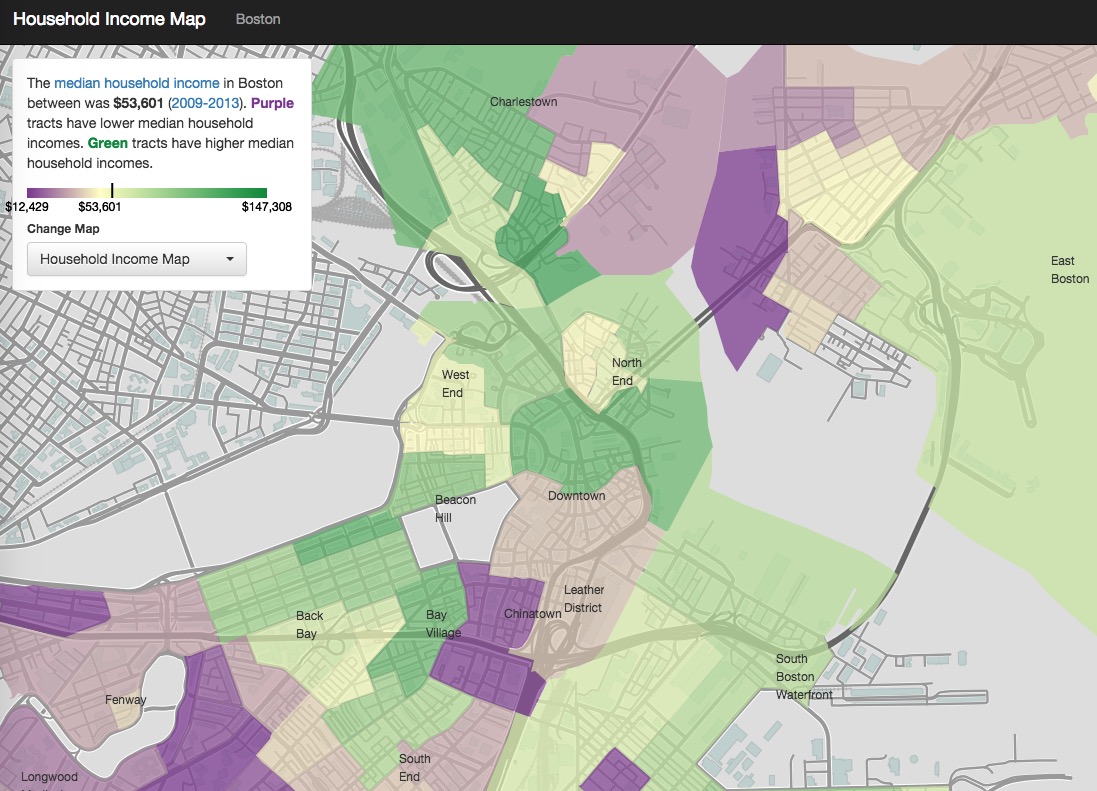
The median household income in Boston is $53,601 (2009-2013). The interior North End tends to be in that range with higher incomes on the waterfront and in downtown Boston. In the map above, green is higher and purple is lower.
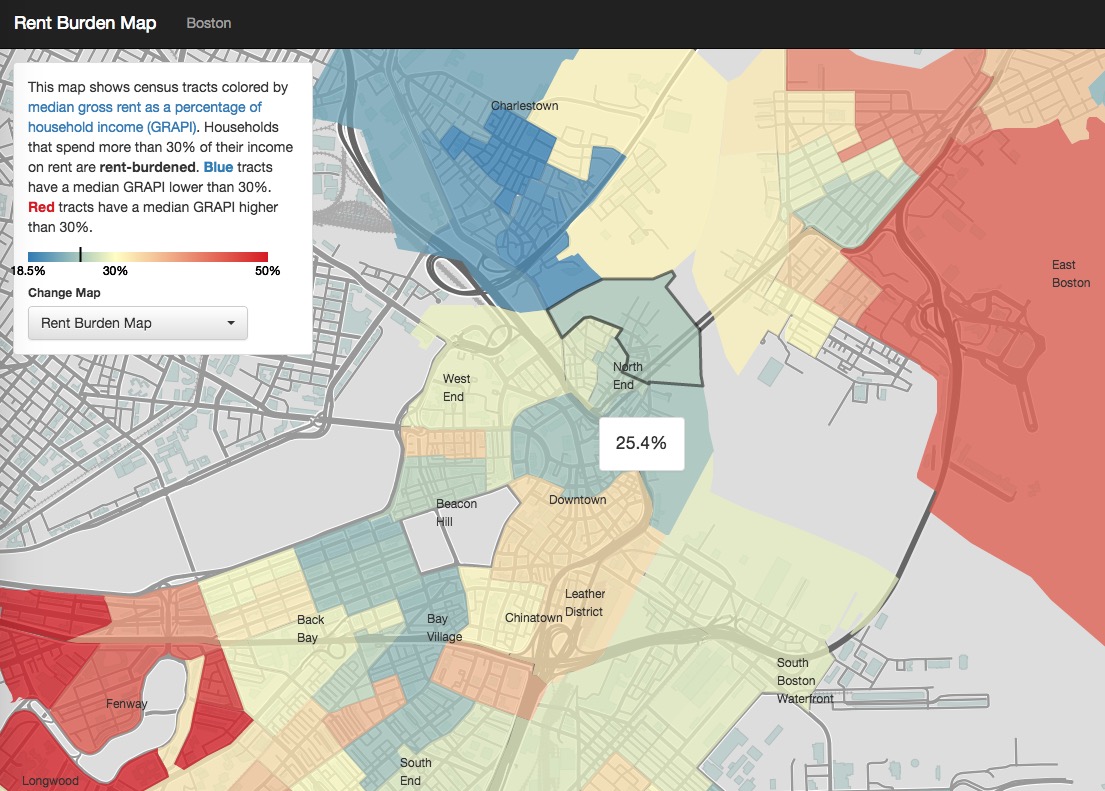
Rent burden – Households that spend more than 30% of their income on rent are considered rent-burdened. The North End is generally below that level with the blue tracts showing a lower rent burden and the red tracks higher.
See more at the interactive version of the map.