So, what happened to cause so much flooding during last week’s winter Nor’easter snow storm? Unlike the near miss of Hurricane Sandy where Boston dodged a (big) bullet, the so called “bomb cyclone” of January 2018 brought a storm surge that hit just at the worst time, an astronomical high tide.
With already over 12 inches of sea level rise since most of Boston was built, more frequent and damaging flooding has been long-predicted by climate change pundits. Not to give away the punchline, but with another 2 feet+ of rising tides in the coming decades, this level of flooding (and worse) will become a regular event, even with normal high tides.
Now, to the numbers. Resident expert Julie Wormer, helps us sort through the data coming out from NOAA, National Oceanic and Atmospheric Association. The rest of this post has Julie’s analysis on how the January 4, 2018 tidal surge.
Bottom line: Draft NOAA data on January 4th’s flood show that it was less than an inch higher (0.72″) than during Blizzard of ’78. February 1978’s flood was considered a 1% (“100-year”) flood. Under old calculations, Thursday would also have been a 1% storm; with updated NOAA calculations on what constitutes a 1% flood, Thursday’s storm tide fell short by all of 1.9 inches.
The National Weather Service confirmws that the old record storm tide was 15.1 feet above low tide (mean lower low water) and Thursday’s record storm tide was 15.16 feet above MLLW.
Data wonks, read on–the graphs are still based on the preliminary data on the NOAA website, but they differ from the final data by less than an inch. The numbers are final.
This preliminary NOAA chart displays the storm in terms of feet above mean higher high water (specifically, the long-term average of the higher of the two daily high tides, but you can think of it as feet above high tide). If you want to see this chart based on NAVD, mean sea level or mean lower low water, click here. More explanation below the chart.

The green line is the storm surge. It stayed close to its peak of three feet for several hours between high and low tide. A three-foot storm surge is not super rare–the fact that it hit at an extra high tide was the problem.
The blue line is the astronomical high tide, which was two feet above normal. Thursday’s mid-day high tide occurred close to a full moon when the moon was closer to the earth in its orbit. This “wicked” high tide was only a few inches below what we consider a “King Tide” (i.e., 12.1 feet vs a maximum of about 12.4 feet above mean lower low water),
The red line combines storm surge and tide to indicate final data for the “storm tide” of MHHW plus 4.814 feet, or 0.06 feet (0.72 inches) higher than the Blizzard of ’78 level (MHHW plus 4.754).
With sea level rise, however, NOAA has increased the level of what it considers a 1% flood from 2.95 meters above mean sea level (sorry about all the units!) to 3.02 meters above mean sea level. The January 4, 2018 flood was 2.971 meters above mean sea level. This means that it would have counted as a 1% storm between 1983 and 2001, but fell 1.9 inches short of what is considered today’s 1% storm. What this means in less wonky terms is that NOAA recognizes that both sea levels and storm intensity have increased over the last few decades (see below).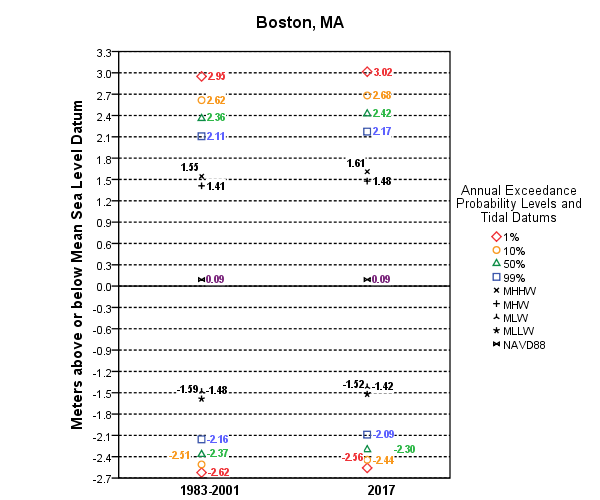
Remember, this is all on top of at least a foot of sea level rise since our historical piers were built. Add two feet of sea level rise to what we have now and we can expect this kind of flooding on an annual basis during winter Nor’easters with normal high tides.
[hr]


You may or may not believe in climate change but Sea Level rise is real. I like warmer weather but I don’t like flooded cities We need to start building the tidal dam in the link ASAP. It’s the only solution. We can either spend $billions$ on this tidal dam or spend $billions$ on fixing broken and damaged infrastructure from flooding. Trump wants to build a wall. This is the kind of wall that needs to be built in Boston. We also have the Harbor Islands to help with the barrier. Many coastal cities don’t have this that natural resources. It’s only going to get worse if we don’t build this. Let’s make this happen. Let’s be the first city in the country to do this. Lets save ourselves from disaster and be proactive about this instead of reactive. Check out this link to see what I am talking about.
http://cache.boston.com/bonzai-fba/Third_Party_Photo/2010/06/04/SEA__1275665801_6760.jpg