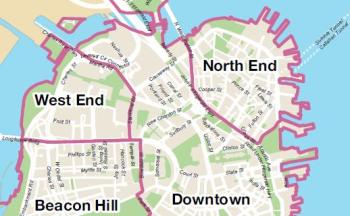
Please note: This post replaces a previous article that used rough census tracts where the numbers were muddied by a large Downtown tract that overlapped with part of the North End neighborhood. The Boston Redevelopment Authority (BRA) Research Division has published more refined neighborhood data for the North End zoning district as defined by the area shown in the map below.
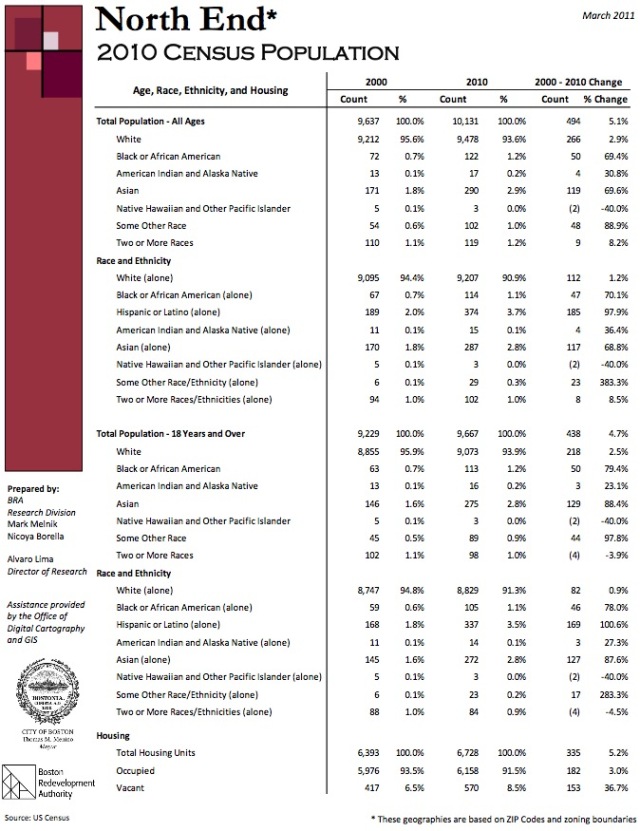
 Neighborhood Zoning Districts. Source: BRA Research Division (Click image for larger pdf document.)The population of the North End zoning district grew by 5.1% over the last 10 years to 10,131 residents, according to recently released 2010 U.S. Census data published by the BRA Research Division.
The growth rate, which added 494 new residents to the neighborhood, is slightly higher than the 4.8% reported for the overall City of Boston where the total population is 617,594. The city’s total residents exceeded the 600,000 mark for the first time since the 1970’s.
From 2000 to 2010, the North End saw its percentage of minority residents increase from approximately 4% to 7%, but the neighborhood remains predominately white from a racial distribution standpoint. This compares to the 53% of minority residents that make up the overall City of Boston population.
North End Children (18 & Younger) Increase 14%
The number of North End children under the age of 18 totaled 464, an increase of 13.7% in the last 10 years to 4.6% of the total North End’s population.
Housing Units Increase by 5.2%
Housing units grew in line with the overall neighborhood population at 5.2% with a total of 6,728 units. However, a 37% increase to 153 was seen in the number of vacant housing units. The number of vacant units in the City of Boston increased 59% over the same period.
Shown below is the detailed BRA North End 2010 Census Population sheet. (More neighborhood sheets available on the BRA’s website.)
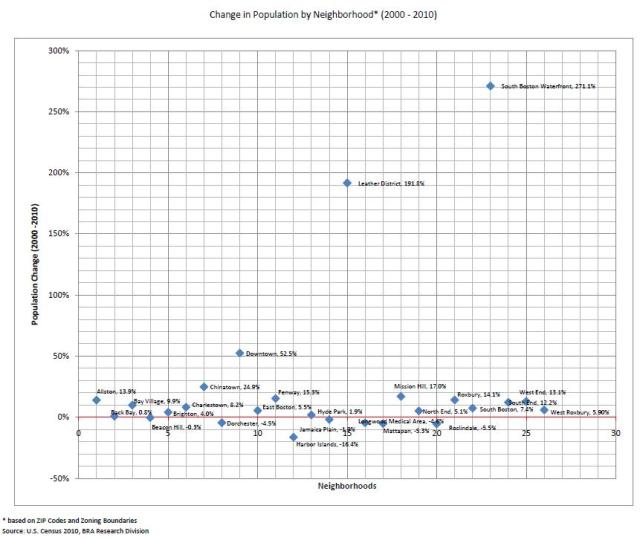
The North End’s population growth of 5.2% compares relatively well to nearby mature neighborhoods, such as Back Bay (0.8%) and Beacon Hill (-0.3%) but lags those areas that have seen large housing additions, such as the surge in Downtown (+52.5%), Chinatown (+24.9%) and the West End (+13.1). The largest increases were seen in the South Boston Waterfront (+271.1%) and the Leather District (+191.8%) which started the decade at relatively low bases. A complete chart of population changes by neighborhood is shown below:
Click image above for larger pdf. Source: BRA Research DivisionRelated posts:
FAQ on defining the North End/Waterfront geographic area


The percent increase in under 18's is 4%, not .4%, if my math is right.
The North End's under 18 population increased by approximately 60 children. I'm surprised that the total is so low. I've been at community meetings where parents and other residents of the North End have been talking about how the Eliot school is bursting at the seams and the need for an expanded / replacement facility.
Can an additional 60 children really be putting as much pressure on the system as people are saying? (Serious question.)
John, By an increase of 0.4%, I meant from 4.2% to 4.6% of the total NE population. But, probably the better way to say it is the percentage increase is actually 13.7% (56 additional children divided by the 2000 total of 408). I added a chart to the post that you can see above with the numbers.
It's an interesting question regarding the Eliot. From what I know about the school in the year 2000, no one really wanted to go there. The turnaround came with the new principal Traci Griffith in the last 5 years or so. Others may want to comment that are closer to the situation, but my sense is that a school with a bad reputation has no demand from parents while a good school has a lot of demand from inside and outside the neighborhood. Lastly, the more relevant number might be the # of children in downtown Boston. The Eliot is the only public school in downtown.
Matt