Readers always enjoy the Zillow Halloween Trick or Treat index as a fun way to gauge neighborhood life using real estate statistics. Numbers don’t tell the whole story, but most folks would probably agree with the impressive North End scores for safety and walkability. After this year’s Halloween post, the folks at Zillow offered to share a complementary neighborhood comparison using their data and we gladly took them up on their offer. Here’s their cut at the North End / Waterfront versus the South End. If folks like this sort of thing, we’ll look at doing other neighborhoods.
North End Vs. South End Real Estate
by Jennifer Riner of Zillow
Boston is a diverse city, consisting of various historical neighborhoods. The City on a Hill features unique eats, lively entertainment and a bustling nightlife throughout all 23 neighborhoods within city limits. Many new Bostonians struggle with finding the perfect place to call home and recent reports state that with increasing interest rates and list prices, now is the time to buy in Boston. However, choosing a specific neighborhood based on budget can prove difficult.
Two of the most popular neighborhoods in Boston, North End and South End, are attractive locales for new buyers. To choose between them, evaluate both markets on their median prices and value projections.
North End and Waterfront
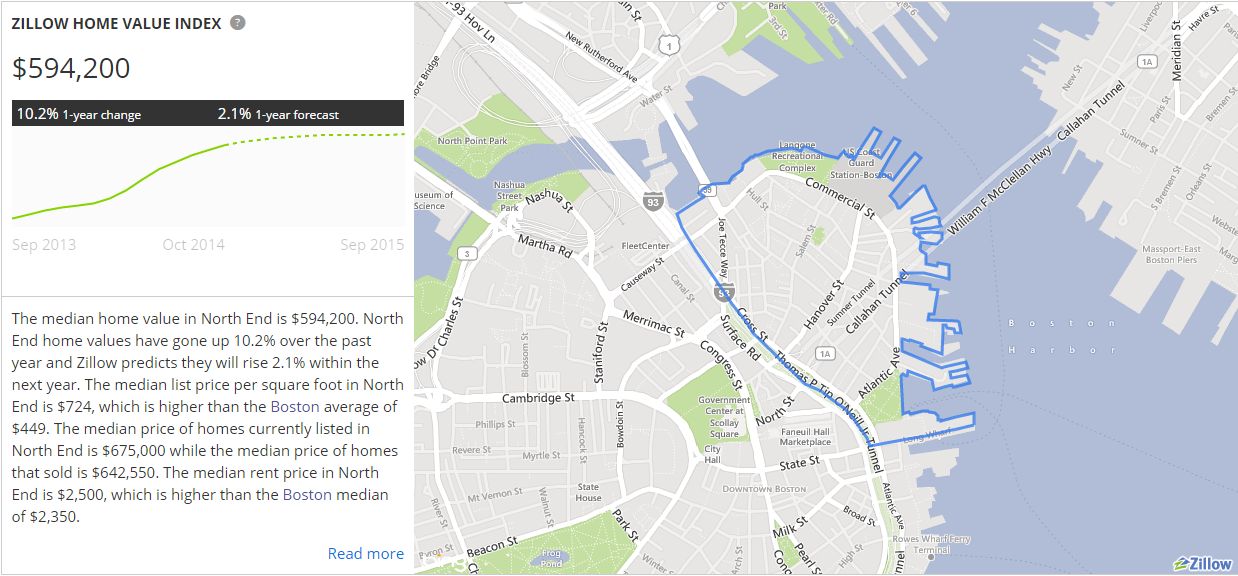
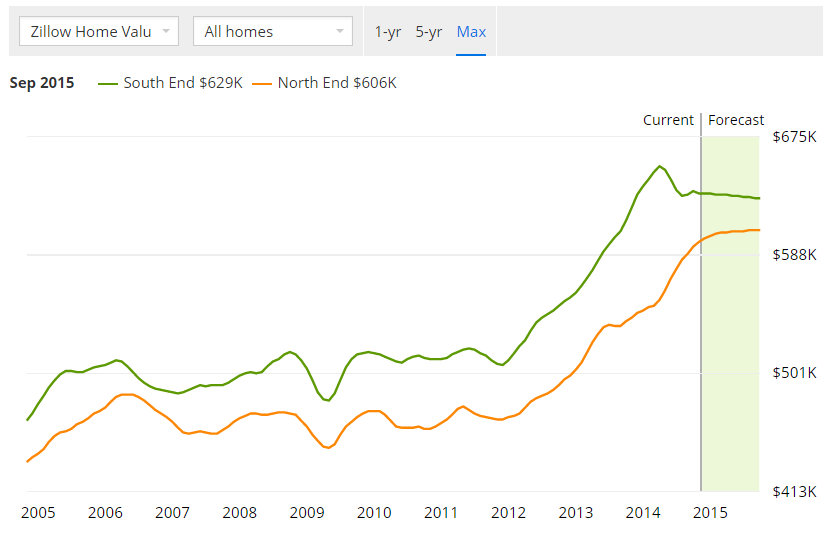
The North End and Waterfront regions come highly recommended – and it’s no surprise why. The Waterfront is fairly upscale, and median prices reflect this good reputation. The median home value in the region is $594,200 – a 10.2 percent increase from last year. Zillow predicts that home values will continue to rise into next year at a 2.1 percent rate, a positive trend for buyers flipping homes and selling them in relatively short periods of time. While the median list price is slightly higher than the median home value at $675,000, the median sale price in the region is $642,550. The difference between list price and sale price indicates some buyer negotiation, allowing many Boston homebuyers to get their money’s worth and bid on homes that might initially fall outside of their price range. Price cuts are common, and 32.9 percent of homes in North End have cut their asking price at some point. However, only 10.8 percent of homes have sold below their listing price, which is lower than Boston proper where 11.4 percent of homes have sold below listing price.
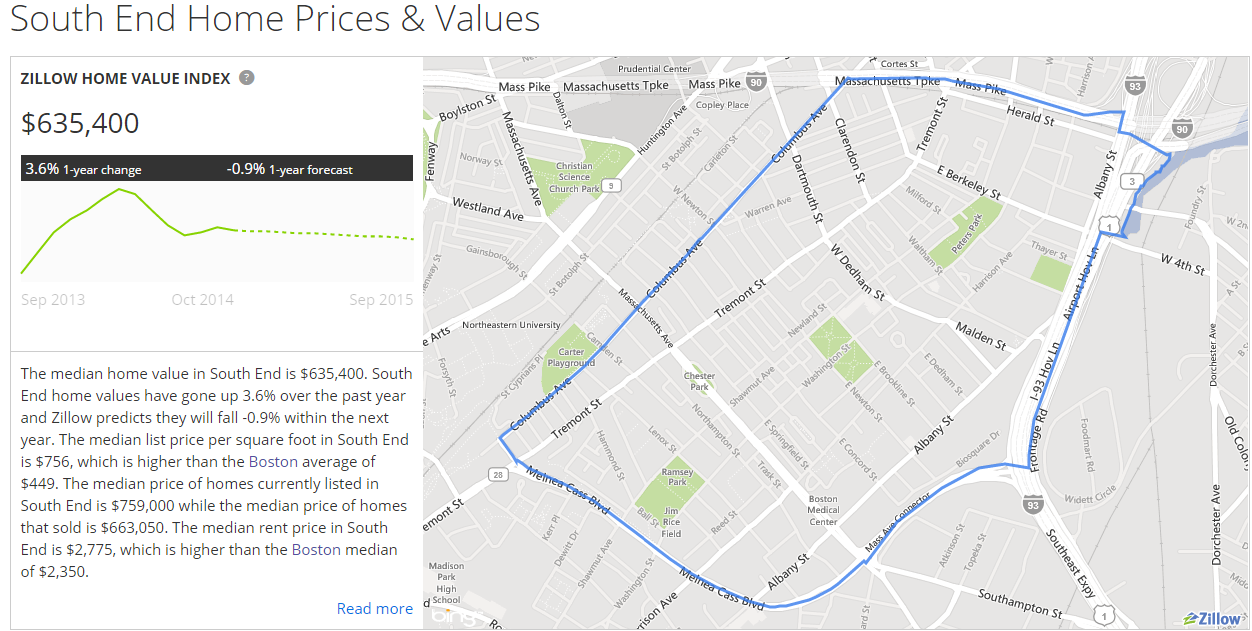
Compared to Boston’s North End, South End home values are high. The median home value is $635,400, reflecting a 3.6 percent increase year-over-year. However, South End home values are expected to fall 0.9 percent over the next year. A projected loss is a significant red flag for new buyers, especially those planning to turn around their properties to receive a return on investment within the next year. Based on this outlook, the North End neighborhood might be a better locale for those looking to sell quickly. Further, the median list price in South End is significantly higher than North End at $759,000, which eliminates many new buyers or those with more modest budgets. Similarly to North End, the median sale price in the South End is lower than the median list price – $663,050 compared to $759,000 – exhibiting some negotiation power for buyers. However, 26.5 percent of listings have lowered their asking price. Although a smaller percentage of listings feature price cuts compared to the North End, a higher percentage of homes have sold for less than their asking price – 13 percent.
Although quite similar to the South End, the North End neighborhood in Boston might be better for buyers with smaller budgets who would like to grow their home values more rapidly. Homeowners with higher budgets can look at South End properties for sale, but might miss out on potential property appreciation that they would otherwise experience in the North End neighborhood.
